When I try to draw diagrams in PowerPoint, I have a hard time deciding on the layout, size, etc., and I have a tendency to not be able to draw quickly.
I thought that it would be better to have a rigidly restricted system, so I considered a tool to create a diagram drawn with text, which is often the case.
 .
.
There are several such tools available, but we decided to use Graph::Easy, which was the simplest and easiest to understand.
Graph::Easy is not that difficult to use, but since it is a CUI tool, it is easy to forget if you do not use it, so I have compiled it here as a personal reminder.
install
Graph::Easy is a Perl module, so use cpan to install it
cpan Graph::Easy
If cpan is not included, install cpan at the following
sudo apt-get install build-essential
treatment
It is easier later to do so via a file, so we will describe that method. The results are output to standard output, so if necessary, redirect to a file.
graph-easy <インプットファイルパス>
manner of writing
Basics: Drawing a line at a node
- Line direction is "straight line", "arrow", and "two-way arrow".
Line types are "-", ". ="
- There are others, but since they are text, you can hardly tell the difference, which is good enough for me.
■入力■
[A]--[B]->[C]<->[D]
[E]..[F].>[G]<.>[H]
[I]==[J]=>[K]<=>[L]

■出力■
+---+     +---+     +---+      +---+
| A | --- | B | --> | C | <--> | D |
+---+     +---+     +---+      +---+
+---+     +---+     +---+      +---+
| E | ... | F | ..> | G | <..> | H |
+---+     +---+     +---+      +---+
+---+     +---+     +---+      +---+
| I | === | J | ==> | K | <==> | L |
+---+     +---+     +---+      +---+
The order of the nodes is fixed with outputs to the left and inputs to the right. It is not possible to write from right to left, i.e., "[B]<-[C]". In such a case, add the line "[C]->[B]".
■入力■
[A]->[B]
[C]->[B]

■出力■
+---+     +---+     +---+
| A | --> | B | <-- | C |
+---+     +---+     +---+
Name the line. Change the display name of a node.
■入力■
[A]--{label:line}[B]
[C]{label:node}--[D]

■出力■
+------+  line   +---+
|  A   | ------- | B |
+------+         +---+
+------+         +---+
| node | ------- | D |
+------+         +---+
There is another way to name a line, "[A]- line ->[B]", but this method cannot be used for lines without a direction (such as "--"), so it is better to use the "label" method, which is easier to remember.
Branching and merging
■入力■
[A]->[B]->[C]
[D]->[B]
[B]->[E]

■出力■
          +---+
          | E |
          +---+
            ^
            |
            |
+---+     +---+     +---+
| A | --> | B | --> | C |
+---+     +---+     +---+
            ^
            |
            |
          +---+
          | D |
          +---+
If you write the connections of each line separately, Graph::Easy will connect them well.
Branch from one point and merge to one point
■入力■
[A]->{start:front,0}[B]
[A]->{start:front,0}[C]

■出力■
+---+          +---+
| A | -+-----> | B |
+---+  |       +---+
       |       +---+
       +-----> | C |
               +---+

■入力■
[A]->{end:back,0}[C]
[B]->{end:back,0}[C]

■出力■
+---+           +---+
| A | ------+-> | C |
+---+       |   +---+
            |
            |
            |
+---+       |
| B | ------+
+---+
Branching and merging in the middle of the line
■入力■
[L1]{shape:edge}
[L2]{shape:edge;label:""}
[A]--[L1]->[B]--[L2]->[C]
[L1]->[D]
[E]->[L2]

■出力■
+---+      L1        +---+               +---+
| A | -------------> | B | ------------> | C |
+---+                +---+               +---+
            |                    ^
            |                    |
            v                    |
          +----+               +---+
          | D  |               | E |
          +----+               +---+
A node can be a point in the middle of a line with "{shape:edge}". If the point name is set to unnamed with label, the name will not be displayed.
grouping
■入力■
(GroupA [A]->[B])
[B]->[C]
[A]->[D]

■出力■
+ - - - - - - - - - -+
' GroupA             '
'                    '
' +------+     +---+ '     +---+
' |  A   | --> | B | ' --> | C |
' +------+     +---+ '     +---+
'                    '
+ - - - - - - - - - -+
    |
    |
    v
  +------+
  |  D   |
  +------+
Groups can be formed by enclosing them with "()". However, it is not so easy to use, so it is better to use it only as an accent.
Change of overall orientation
■入力■
graph{flow:south}
[A]->[B]

■出力■
+---+
| A |
+---+
  |
  |
  v
+---+
| B |
+---+
If nothing is set, the figure is drawn from left to right, but you can specify the overall orientation with "graph{flow:[north|south|east|west]}".
Specify the surface from which the line will exit and the surface into which it will enter.
■入力■
[A]->{start:north; end:south}[B]

■出力■
  +----+
  |    |
+---+  |  +---+
| A |  |  | B |
+---+  |  +---+
       |    ^
       +----+
If you really want to decide that the line goes out from this side and in to this side, you can specify it. It is also possible to specify only one or the other.
Multiple lines parallel from the same surface
■入力■
[A]->{start:east}[B]
[A]->{start:east}[C]
[A]->{start:east}[D]

■出力■
+---+     +---+
|   | --> | B |
|   |     +---+
|   |     +---+
| A | --> | C |
|   |     +---+
|   |     +---+
|   | --> | D |
+---+     +---+
When multiple lines are defined from the same surface, they are parallel.
Change the border of a node
■入力■
[A]->[B]{border:dotted}

■出力■
+---+     .....
| A | --> : B :
+---+     :...:
There are others, but since they are text, you can hardly tell the difference, which is good enough for me.
text wrap
■入力
[A\nB]->[C]{label:C\nD}

■出力■
+---+     +---+
| A |     | C |
| B | --> | D |
+---+     +---+
You can insert a line break with "\n.
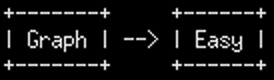
Image output
When outputting in DOT format and converting to an image
sudo apt-get install graphviz
PNG output with "-png" option
graph-easy <入力ファイル名> -png
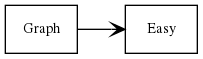
To specify the image size, once output in "dot" format, pass it to "dot" and specify it in the options.
graph-easy <入力ファイル名> -as_dot | dot -Tpng -Gsize=1 -Gdpi=500 -o <出力ファイル名>
Above is an example of 500px output. The maximum value of either the height or width, whichever is larger, is the specified value. (It seems impossible to specify only vertical or horizontal size.)
To convert text into an image
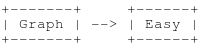
sudo apt-get install imagemagick
Output by specifying color and size
graph-easy <入力ファイル名> | \
    head -c -1 | \
    convert -background "#ffffff" -fill "#000000" -font "FreeMono" -size 100x100 \
    label:@- <出力ファイル名>
Since there is a new line at the end, it is removed by "head -c -1".
If you want to specify the width and the height, "-size 100x" does not specify the height. However, the vertical size of the output image at that time will be the height of one font, so calculate the actual vertical width based on the number of vertical lines of text, and output the image again with "-size 100x\
If you want to specify the height and make the width good, use "-size x100" and do not specify the width.