Tableau is intuitive, and you can create graphs by dragging and dropping with the mouse.
However, when trying to port Excel graphs to Tableau, sometimes it is not possible to create a graph properly using only mouse operations.
Such graphs are often solved by using Tableau's Level of Detail (LOD) function, but LOD is conceptual and requires manual input of formulas, so it is easy to forget how to use it if not used for a while.
So, here I would like to make a note of how to use Tableau's LOD for my own use.
Until the graph is displayed in Tableau
First, to understand LOD, it is easier to know what data is displayed in a graph in Tableau.
Tableau data starts with the first data source.
- context
- filter (esp. camera)
- dimension
The data is then narrowed down in the order of the rows and columns, and finally the graph is displayed using the data within the range delimited by the rows and columns.

The granularity delimited by rows and columns is the smallest unit, and usually, calculations for granularities smaller than this or, conversely, larger than this cannot be performed within this delimitation.
If you look at Excel graphs that cannot be created using only mouse operations in Tableau, many of the graphs are a mixture of calculations with this different granularity.
What are different granular calculations?
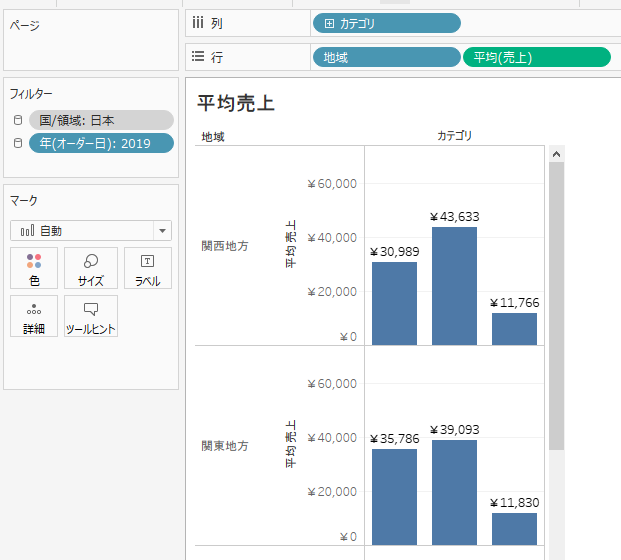
For example, suppose you have a graph of average sales, broken down by region and category.
Small particle size
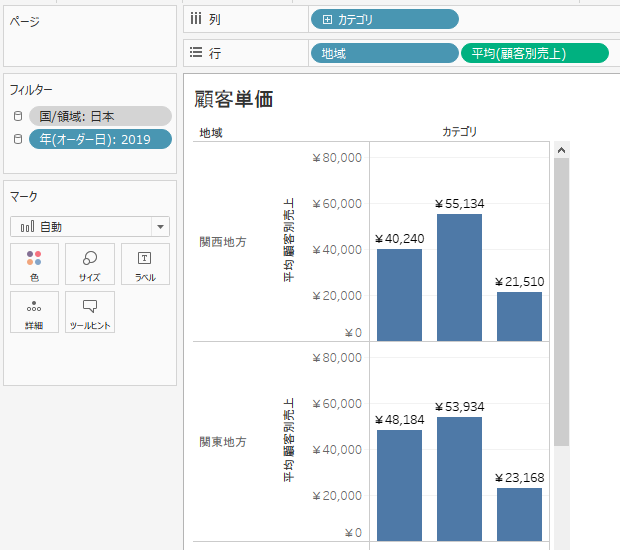
This is the case, for example, if you want to graph the cost per customer.
To do this, we calculate totals by customer and graph the average, but since the dimensions of the graph are up to "region/category," we need to calculate at a smaller granularity of "customer.
Large grain size
This is the case, for example, when you want to produce a graph of the difference from the regional average.
To do this, the average within a region is calculated and the average is subtracted from the original region/category average to create a graph, since the dimensions of the graph are separated by region/category, The average within a region must be calculated at a larger granularity, beyond the "category" boundaries.
These calculations for granularities other than those separated by rows and columns cannot be done with mouse operations alone and require the use of LOD.
Now let's look at how to create the above graph using LOD.
INCLUDE
This is used when you want to calculate at a finer granularity than the granularity delimited by rows and columns.
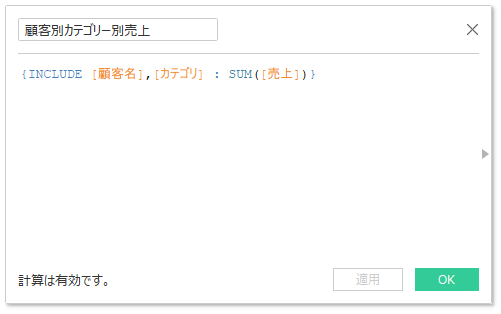
The aforementioned sales per customer are calculated by the following formula.
Sales by Customer
{INCLUDE [顧客名] : SUM([売上])}
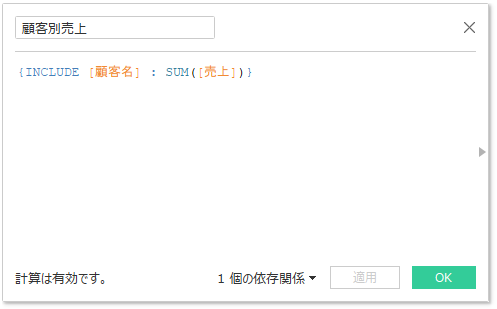
Dropping this into the graph and taking the average will result in the aforementioned "cost per customer" graph.
Using the data refined by rows and columns, the calculation is further subdivided by the dimension specified by INCLUDE.
Multiple dimensions can also be specified, separated by commas.
As mentioned above, INCLUDE is applied to the data after it has been refined by the context filter dimension.
EXCLUDE
It is used when you want to calculate a granularity that is separated by rows and columns but ignores (crosses barriers) the specified dimension.
The aforementioned difference between the category average and the regional average is calculated by the following equation.
Category average (overall average difference)
{INCLUDE [カテゴリ]:AVG([売上])} - {EXCLUDE [カテゴリ]:AVG([売上])}
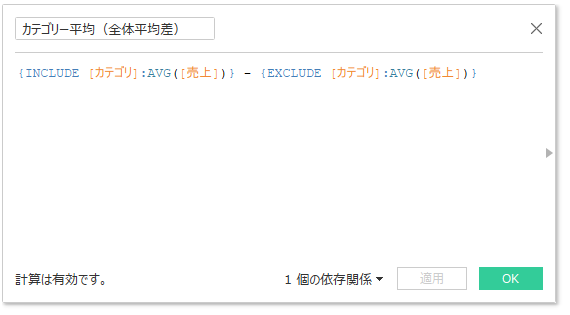
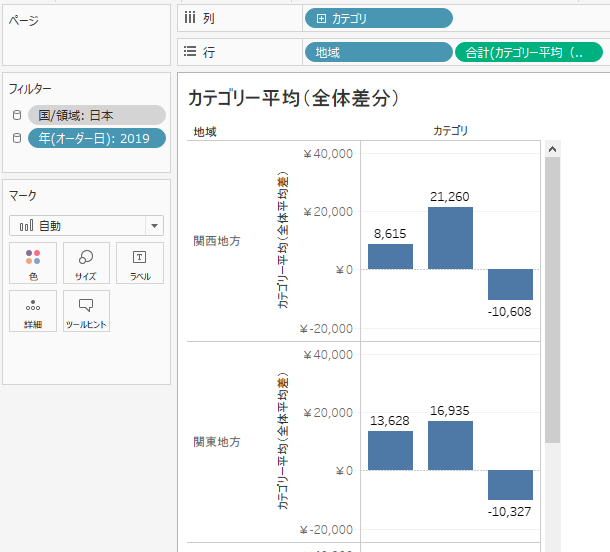
Dropping this into the graph will result in a "Category Average (Overall Difference)" graph.
As with INCLUDE, multiple dimensions can be specified by separating them with commas.
The EXCLUDE is applied after the data has been filtered.
What this means is that the only barriers that can be crossed by EXCLUDE are the dimensions separated by rows and columns, and that calculations beyond the context filter barriers are not possible.
FIXED
Use this function when you want to calculate only on a specified dimension.
Even if filters, row and column dimensions are set, they are completely ignored, as if they had never existed.
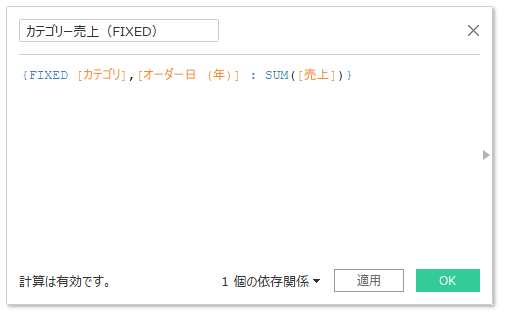
For example, category sales are calculated by the following formula
Category Sales (FIXED)
{FIXED [カテゴリ] : SUM([売上])}
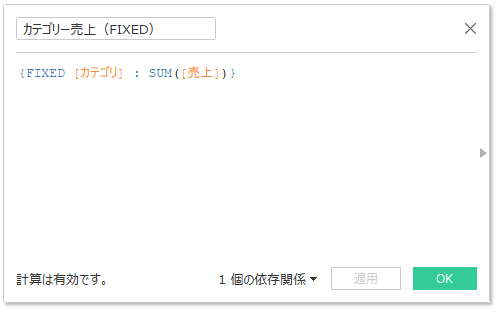
Drop this into the graph to create a "Category Sales" graph.
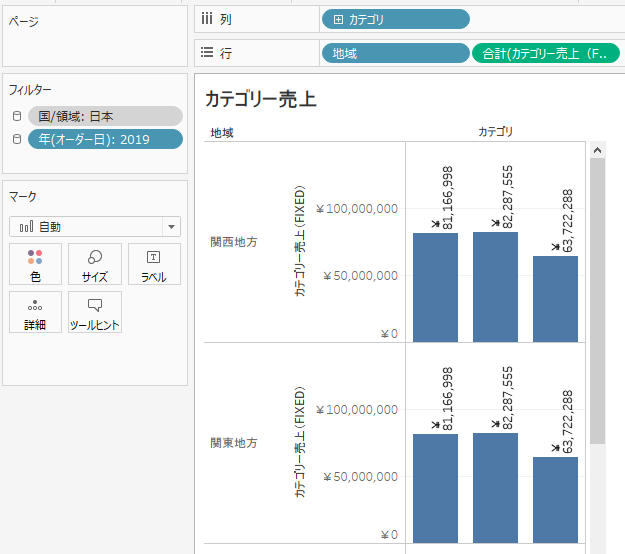
The values are the same for different regions, indicating that the regional dimension is ignored.
As with INCLUDE and EXCLUDE, multiple dimensions can be specified by separating them with commas.
FIXED is applied to the data after it has been refined by the context.
The filter is ignored, so the "Category Sales" graph above shows category sales for all years, regardless of the filter, even though the "Year" filter is applied.
Dimension of date and time
Date and time data can be specified as "year, month, day," or any other granularity with a mouse operation.
![]()
However, when specifying dimensions in LOD, putting the date/time dimensions as they are will not work.
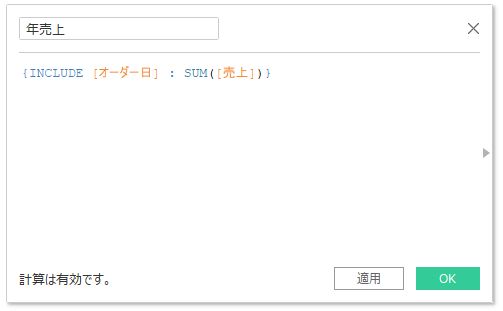
When specifying a date/time dimension with arbitrary granularity in LOD, create a dimension with the granularity you want to divide from the date/time dimension, and specify LOD for that dimension.
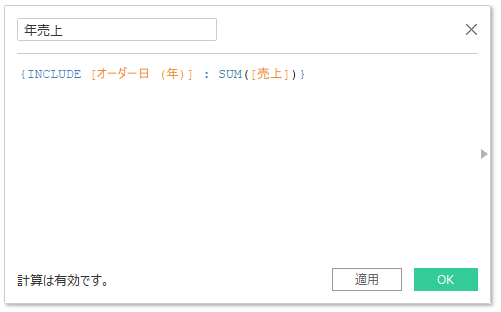
For example, to LOD at a year granularity, create a year dimension from a date/time dimension.
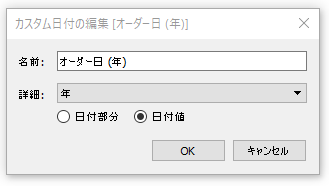
The year dimension is then used in the LOD.
Impressions, etc.
While INCLUDE and EXCLUDE are similar to each other in that they start from the normal graph and add and delete dimensions, FIXED is a bit different in that it ignores filters and looks only at the specified dimensions.
In particular, be aware that when FIXED is used in a graph with filters, FIXED may forget to ignore the filters and tabulate a wider range of data than expected.
In a graph with filters, if you want to apply a specific filter in FIXED, you can do so by adding the dimension of the filter you want to apply in FIXED.
For example, in the "Category Sales" graph using FIXED above, to enable the year filter, adding a "year" dimension to FIXED will work.